by Adrian Glasser
This is a blog about the development of a computer controlled squeezing instrument to be used in laboratory research for measuring mechanical stiffness of small samples, such as lenses.
The author of this blog has no commercial relationship with Futek, the company that makes the load cell that was used in this application.
A squeezer applies a force through a load cell onto a sample. The applied force can be based on a known magnitude of movement of a sturdy linear actuator driving down onto the sample with a fixed magnitude of linear displacement or it could be through recording the force from the load cell continuously while the linear actuator moves down onto the sample until a pre-defined load is measured.
Testing of this nature has been performed with a prior version of such a squeezer. Various different samples can be tested in this way. Below is a video and data collected from testing performed on a spherical hydrogel sample. The video shows the linear actuator moving down onto the sample in 6 sucessive steps at 10 second intervals and then up again in 6 sucessive steps. The video is created by capturing an individual image after each step-displacement has been applied by the linear actuator, so the video plays over a much shorter time than the time over which the actual test was performed. The force data is collected during the test by continuously recording the load output from the load cell.
To build the squeezer, first, it is necessary to identify an appropriate load cell that can be used to measure force and from which data can be read into a computer via custom-developed software. The software used for this process will be MATLAB as that is the programming language that I am most familiar with, especially for allowing a computer to communicate with hardware. In this case, the hardware will ultimately consist of several different things, including a linear actuator, one or two video cameras and the load cell.
The load cell that will be used is the LSB200 from Futek. This is a load cell rated to 10g which should prove suitable for this application. The LSB200 connects to a computer via the Futek USB220 which, as the name implies, is a USB output device which sends signals from the load cell to the computer. The USB220 can output data at about 1000 samples per second. Simple MATLAB code is able to read from the load cell at about 500 samples per second. However, a sampling rate of only about 30 to 100 samples per second will be required for this application.
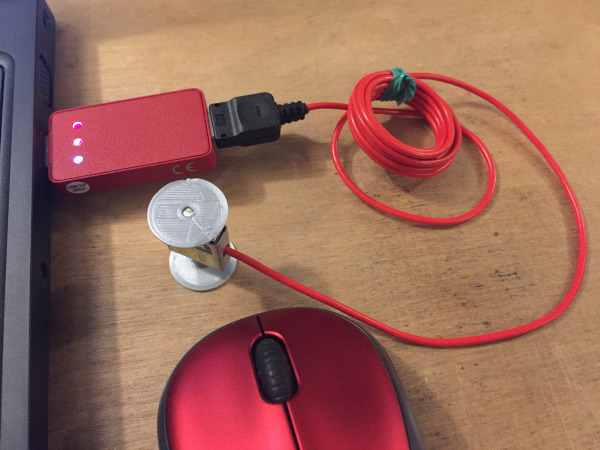
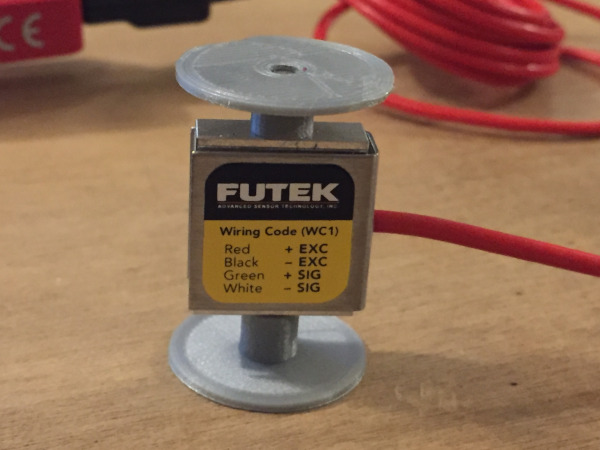
The load cell has two M3 threaded holes, one on top and the other on the bottom. A custom designed, 3D printed stand and platform have been added to the top and bottom of the load cell so the load cell stands upright and so test samples can be placed on the top platform to change the force on the load cell so the changes in the force values being read from the load cell can be seen in the software in real-time. This 3D printed stand and platform are simply for ease-of-use while developing the software and they will be replaced later with other attachments to the load cell.
There is some minimal example MATLAB code on the Futek web site of how to read from the load cell and there is extensive documentation on the Futek web site on the software functions that are available to interact with the load cell. However, to accomplish this task will require development of MATLAB software that is capable of performing all the functions required of the squeezer. There is remarkably little in the way of publicly available information or example MATLAB code of reading from Futek load cells. Futek refer user of their products to the own SENSIT software to read from their sensors. I will not be able to use the SENSIT software for this application as the squeezer will need to interact with other hardware, which the SENSIT software cannot do.
The custom developed software will be a Graphic User Interface (GUI) based application written in MATLAB that can be installed and run on a Windows based computer.
Here below is a short video of the initial GUI based software application, showing some elementary capabilities for interacting with the load cell. The video is best viewed in full-screen so the details can be seen. The connection to the load cell can be opened, data can start to be read from the load cell in real-time, a tare function has been implemented to tare the recorded force (i.e., set it to zero), reading from the load cell can be stopped and the load cell connection can be closed. The load cell is extremely sensitive and, in this recording, all that is being recorded from the load cell are finger taps on the table on which the load cell is resting. At the start of the video, the load cell is recording about 2 grams and this is the weight of the 3D printed platform that is mounted above the load cell.
The MATLAB code for reading from the load cell has now been partially integrated with a larger application that will ultimately run and control the squeezer. This software application does a lot of things, all of which will not be described here. The primary point of this development stage is to integrate the real-time load recording from the load cell with a live-streamed video feed from a USB video camera. Both of these capabilities have been integrated in the software and are demonstrated in the video below.
View the video in full-screen mode to see the details. First the video camera is connected and then a live video feed is started with the Grab push button. Once the live video is started, the load cell is connected, the real-time load reading is started, the tare button is pressed to set the load cell reading to zero and then a tablet is placed on the platform above the load cell and is then removed a few seconds later so the real-time response from the load cell can be observed on the graph. Note from the real-time recording from the load cell that the load cell is extremely sensitive and that the load recorded from placing the tablet on the platform is far greater than the load created from just the static weight of the tablet.
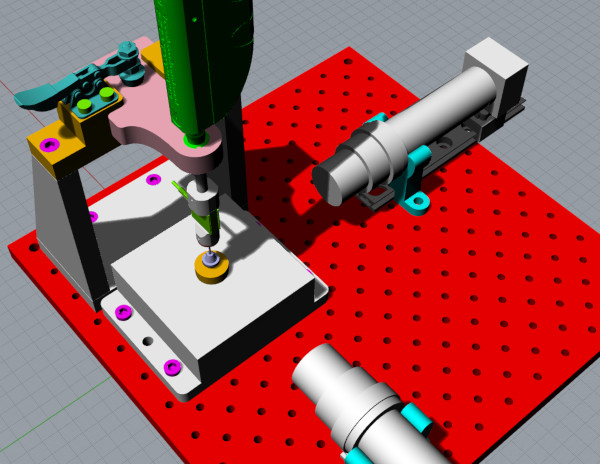
The whole squeezer instrument was designed in computer aided design (CAD) software. The design includes two video cameras viewing the sample from 90 degrees apart to aid in alignment of the sample. The system is mounted to drilled and tapped aluminium optical breadboard. The major parts are manufactured from CNC milled aluminium. A variety of commercially available parts are incorporated, including the breadboard, the linear actuator, the load cell and two video cameras.
The software has been developed further to allow two video cameras to be connected, to allow the load cell to be connected and the allow the linear actuator to be connected so as to be able to run a squeezing protocol on a sample to be tested. Shown below is an image of the graphic user interface (GUI) with these controls. The user entered parameters are used to run the squeezing protocol and video images are captured at pre-defined time-points during the squeezing to create a video file composed of the individual video frames. Shown here is a polymer sample being squeezed and the data that was captured from this protocol.
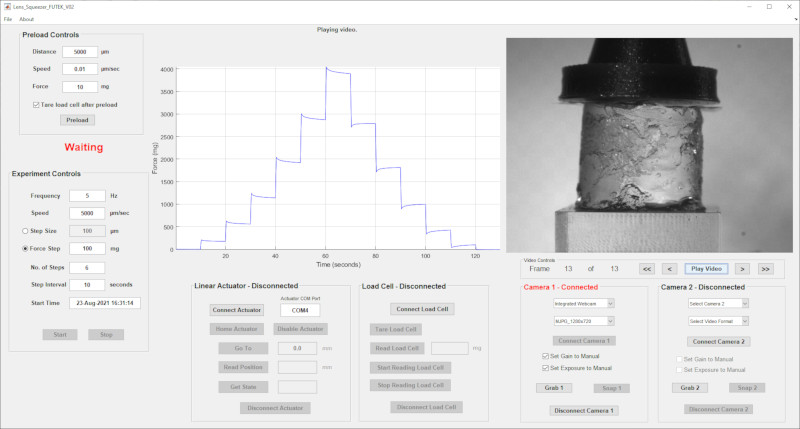
Here below is a video captured during the squeezing protocol showing the sample being compressed in six sucessive steps after which the compression is releived in six sucessive steps.
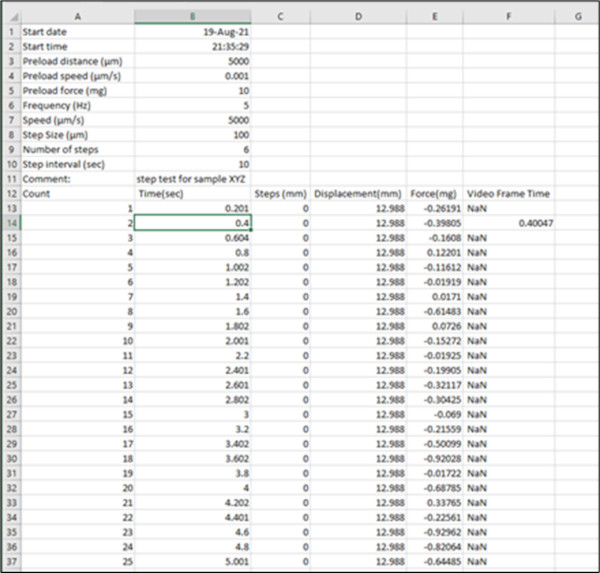
The data captured is saved to a file for later analysis. The data file contains the parameters used to define the squeezing protocol, the times at which each data point was acquired, the load values recorded throughout the test, the linear actuator position throughout the test, the times at which each video image was captured during the test protocol, etc.
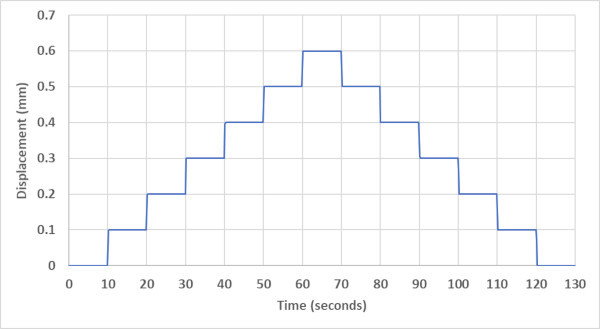
Below is a graph showing the results of a Step-Size protocol where the linear actuator is set to move in defined step sizes, in this case six steps down followed by six steps up of 100 micrometers each, with a 10 second interval between each step.
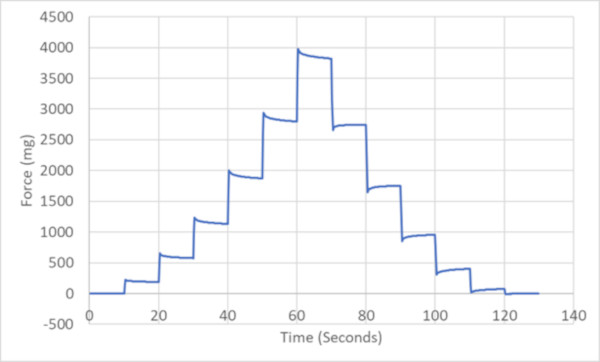
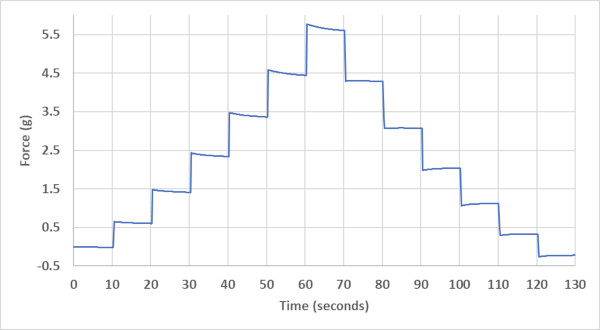
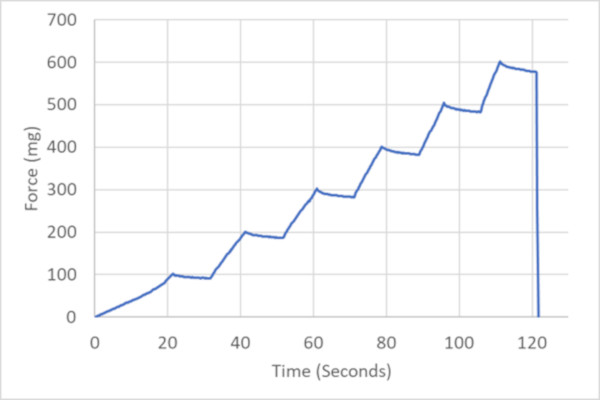
Below is a graph showing the results of a Force-Step protocol where the linear actuator is set to move until a specified force is achieved, in this case six steps of 100 mg each, with a 10 second interval between each step. When the last step is completed, the linear actuator returns to the start position.
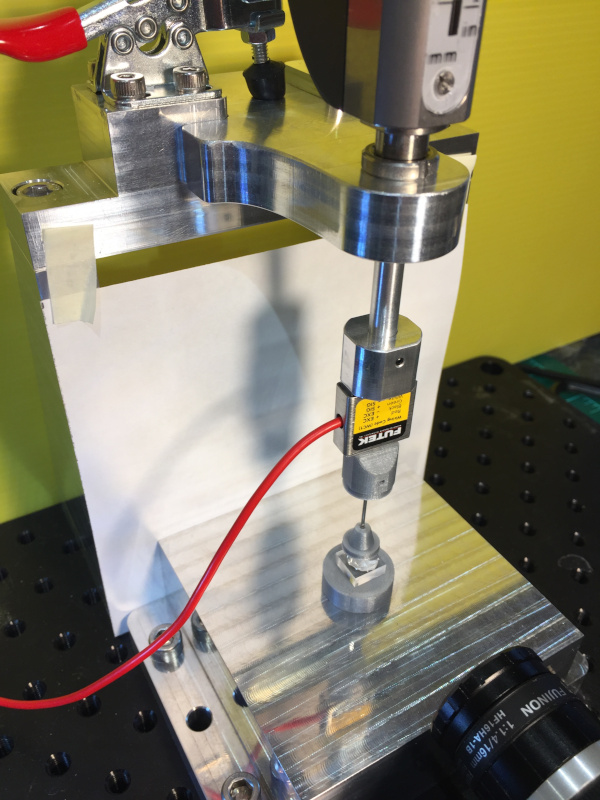
Here below is an image of the final instrument. The structure is made from CNC milled aluminium. A sheet of white paper is taped to the structure behind the sample so the sample can be back-illuminated for the video camera which can be seen in the lower right corner.
The instrument is now working well and reliably. Two versions of the instrument have been built for slightly different applications.
Lens stiffness has been measured in several publications using lens squeezers that are very similar in design to the system described here:
Baradia, H.; Nikahd, N.; Glasser, A. Mouse lens stiffness measurements. Exp. Eye Res. 2010, 91, 300–307.
Panja S, Gaikwad H, Rankenberg J, Nam MH, Nagaraj RH. Promotion of Protein Solubility and Reduction in Stiffness in Human Lenses by Aggrelyte-1: Implications for Reversing Presbyopia. Int J Mol Sci. 2023 Jan 22;24(3):2196.
Panja S, Nam MH, Gaikwad H, Rankenberg J, Nagaraj RH. Topical ocular application of aggrelyte-2A reduces lens stiffness in mice. Front Ophthalmol (Lausanne). 2023 Oct 31;3:1274825.
Panja S, Nahomi RB, Rankenberg J, Michel CR, Gaikwad H, Nam MH, Nagaraj RH. Aggrelyte-2 promotes protein solubility and decreases lens stiffness through lysine acetylation and disulfide reduction: Implications for treating presbyopia. Aging Cell. 2023 Apr;22(4):e13797.